We seek to provide you with the information you need to be a knowledgeable user of quantitative methods, including updates on ongoing developments in the field, discussion of common data analytic concerns, tutorials on commonly used techniques, and software scripts and tools. Our vision is to become a hub for researchers seeking guidance on quantitative data analysis.
Conference Workshop Materials

Longitudinal Data Analysis: Knowing What to Do and Learning How to Do It
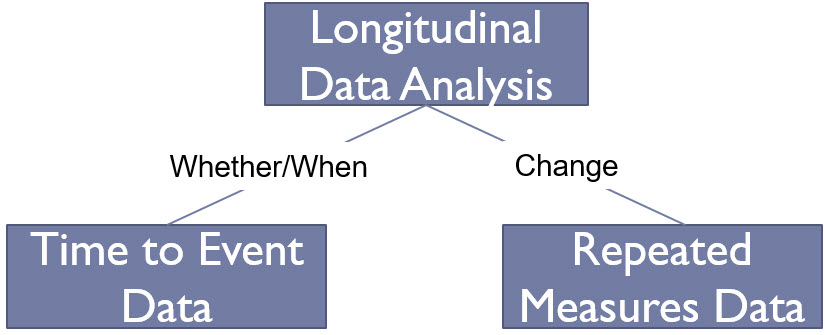
Curran-Bauer Analytics conducted a professional development workshop on longitudinal data analysis at the Society for Research in Child Development conference on March 22, 2019. We have posted the handout and slides here and hope that others may find these useful. Feel free to share these with colleagues or to use the slides in your own presentations.

Introduction to Growth Curve Modeling
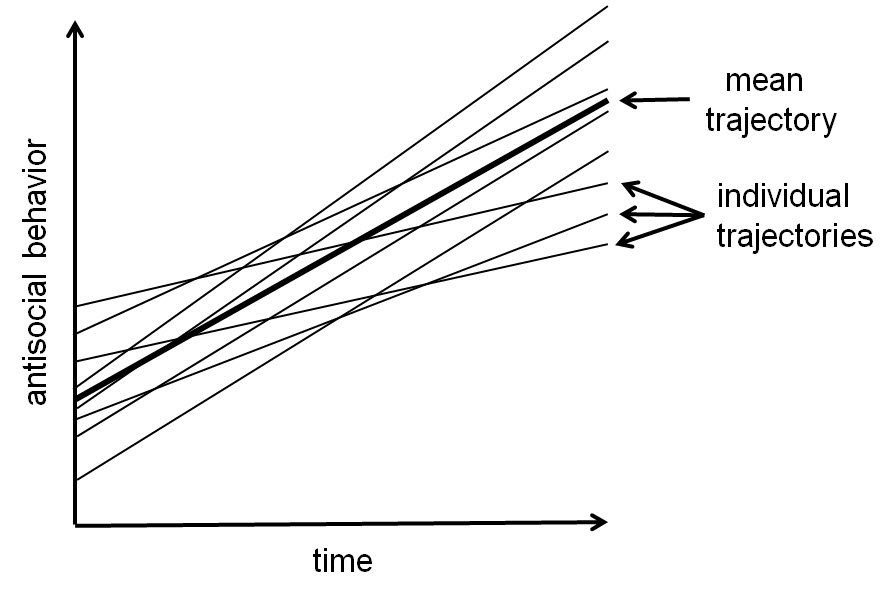
We are pleased to make available a number of materials related to Introduction to Growth Curve Modeling, a workshop we conducted at the Society for Research on Adolescence on April 3, 2016. We have posted a copy of the slides as well as example data and syntax files for fitting mulitilevel growth models in SAS, SPSS, and Stata and latent curve models in Stata and Mplus. We hope these resources will be of use to those who are beginning to consider the use of growth models in their own research.
Software Resources

Fitting Structural Equation Models with the lavaan Package in R
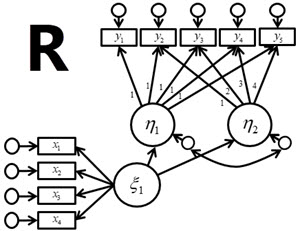
We are pleased to make available for public use the software documentation from our popular Structural Equation Modeling summer workshop. This includes a 172-page PDF file containing detailed descriptions of how to fit and interpret SEMs using the lavaan package in R. Additionally, we provide a ZIP file that contains data files and R scripts for all examples. The R program and lavaan package are free, open source programs. These notes and scripts were developed using R version 3.5.2 and lavaan version 0.6-3. As these programs evolve, some commands may change.

Syntax for Computing and Saving Random Effect Estimates in SPSS
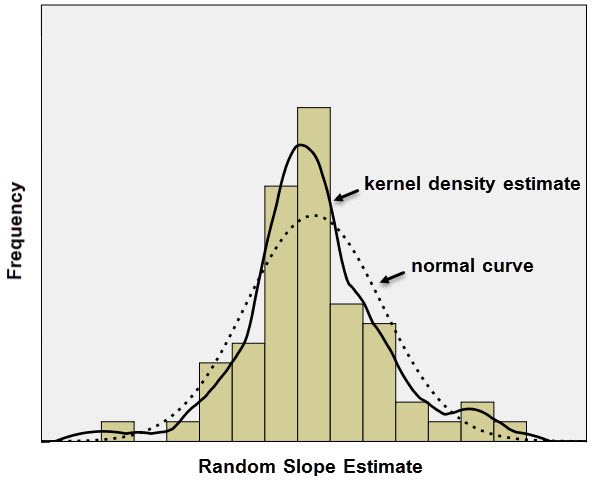
Many programs can be used to fit multilevel models. For instance, in our Multilevel Modeling summer workshop, we demonstrate three programs: SAS, SPSS, and Stata. With SPSS, however, it can be somewhat tricky to generate estimates of the random effects and save these to a data file. We have thus developed documentation and syntax for computing and saving random effect estimates in SPSS based upon output that is easily obtained from the MIXED command. Note that the procedures depend on the version of SPSS given new additions to the MIXED command beginning in Version 25. Click the link for your version below.
Informational Videos and Blog Posts

Help Desk Blog
In our Help Desk blog, Dan and Patrick respond to commonly asked questions about a variety of topics on behavioral, educational, and health research, including experimental design, measurement, data analysis, and interpretation of findings. The responses are intentionally brief and concise, and additional resources are provided such as recommended readings, provision of exemplar data and computer code, or links to other potential learning materials. Readers are welcome to submit their own questions for future Help Desk responses at [email protected].
A major challenge for many researchers is keeping up with the latest opinions and developments with data analytic practices and techniques. We also use the blog to highlight items from the literature and news that we think may be of interest for applied researchers in the behavioral, health, and social sciences. Our posts cover a variety of topics, including new developments in data analysis, useful new data analytic tools, general issues in statistics, and news items relating to statistics. We hope you will find these posts informative and useful.
Office Hours on YouTube
In an ongoing series of short informal videos, we answer frequently asked questions about statistical methods. Topics range from introductions to modeling techniques (e.g., "What is growth curve modeling?") to comparisons between techniques (e.g., "What's the difference between finite mixture models and cluster analysis?") and questions about the application of these techniques in practice (e.g., "How many clusters do I need to fit a multilevel model?"). We also often include links to other resources for those wishing to learn more about each topic.

